

The Vast Majority of Perpetrators Will Not Go to Jail or Prison
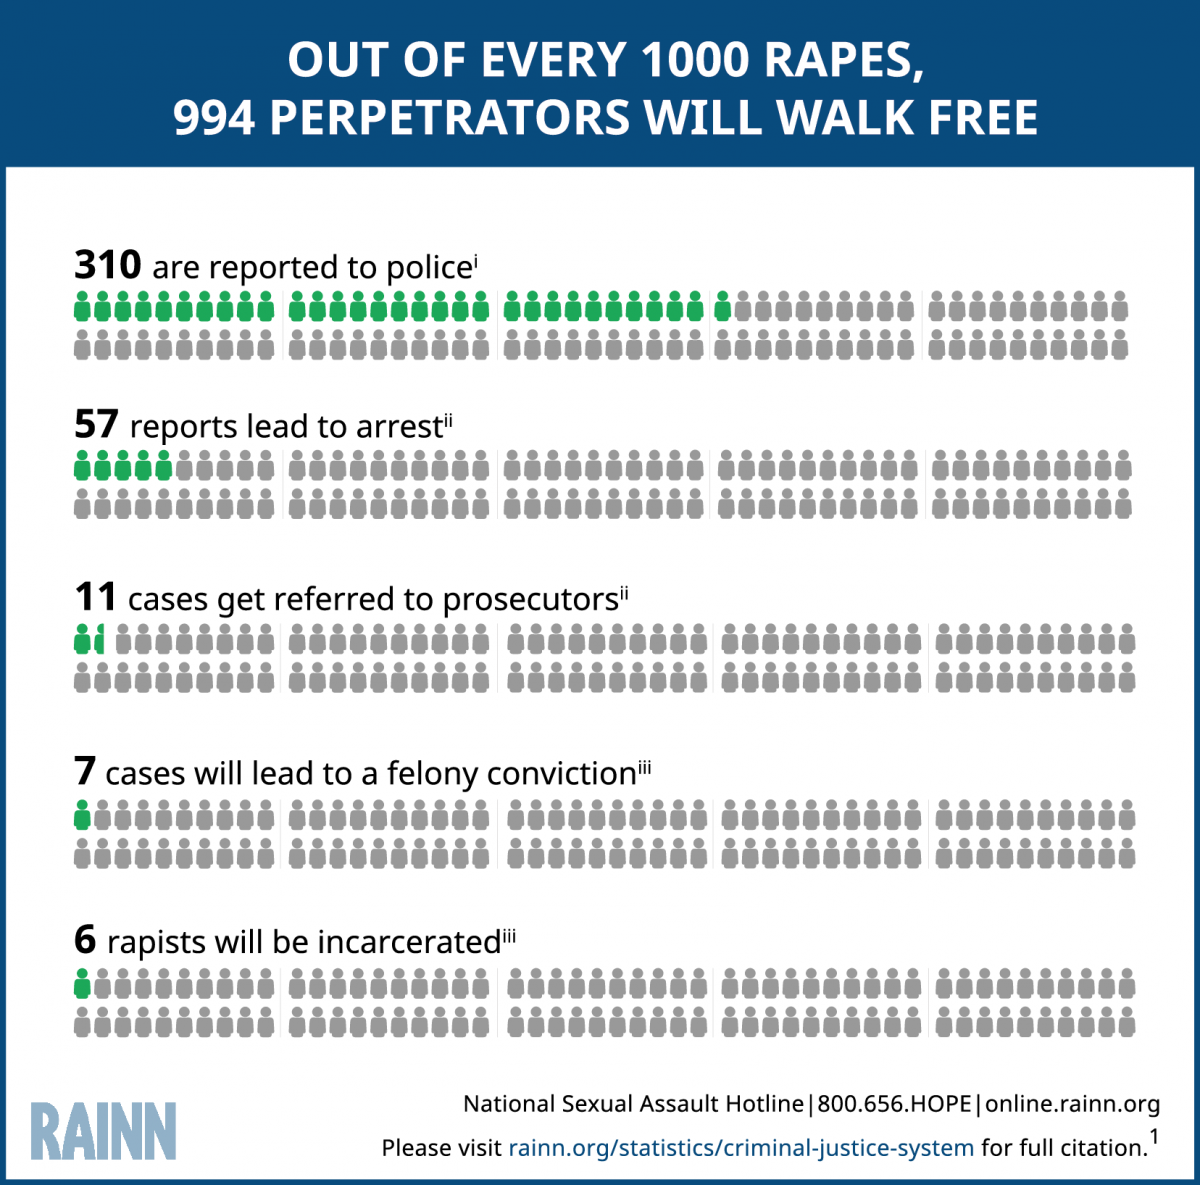
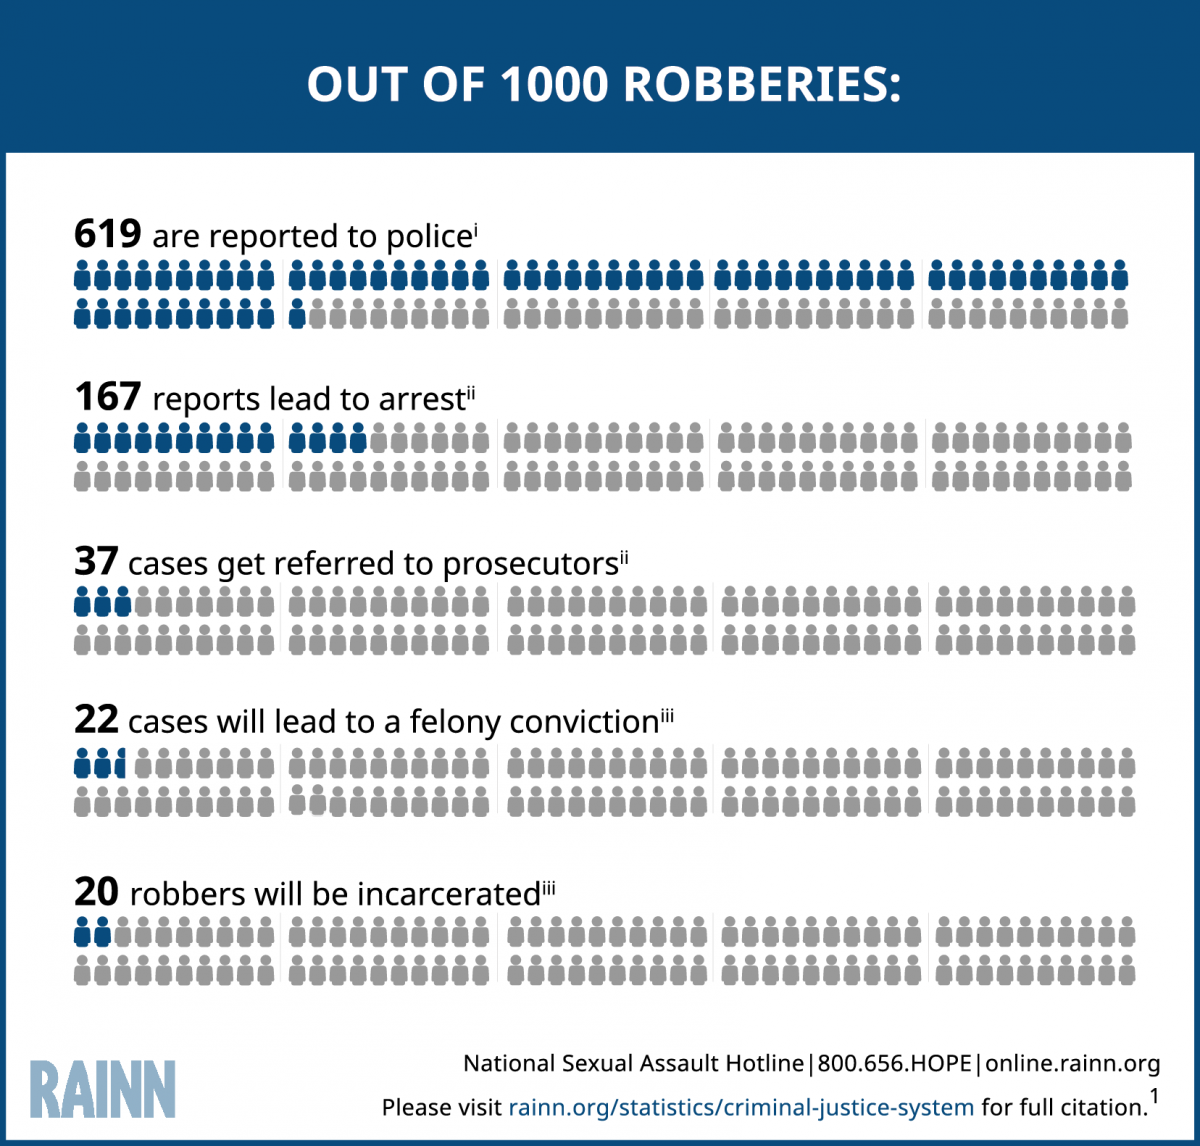
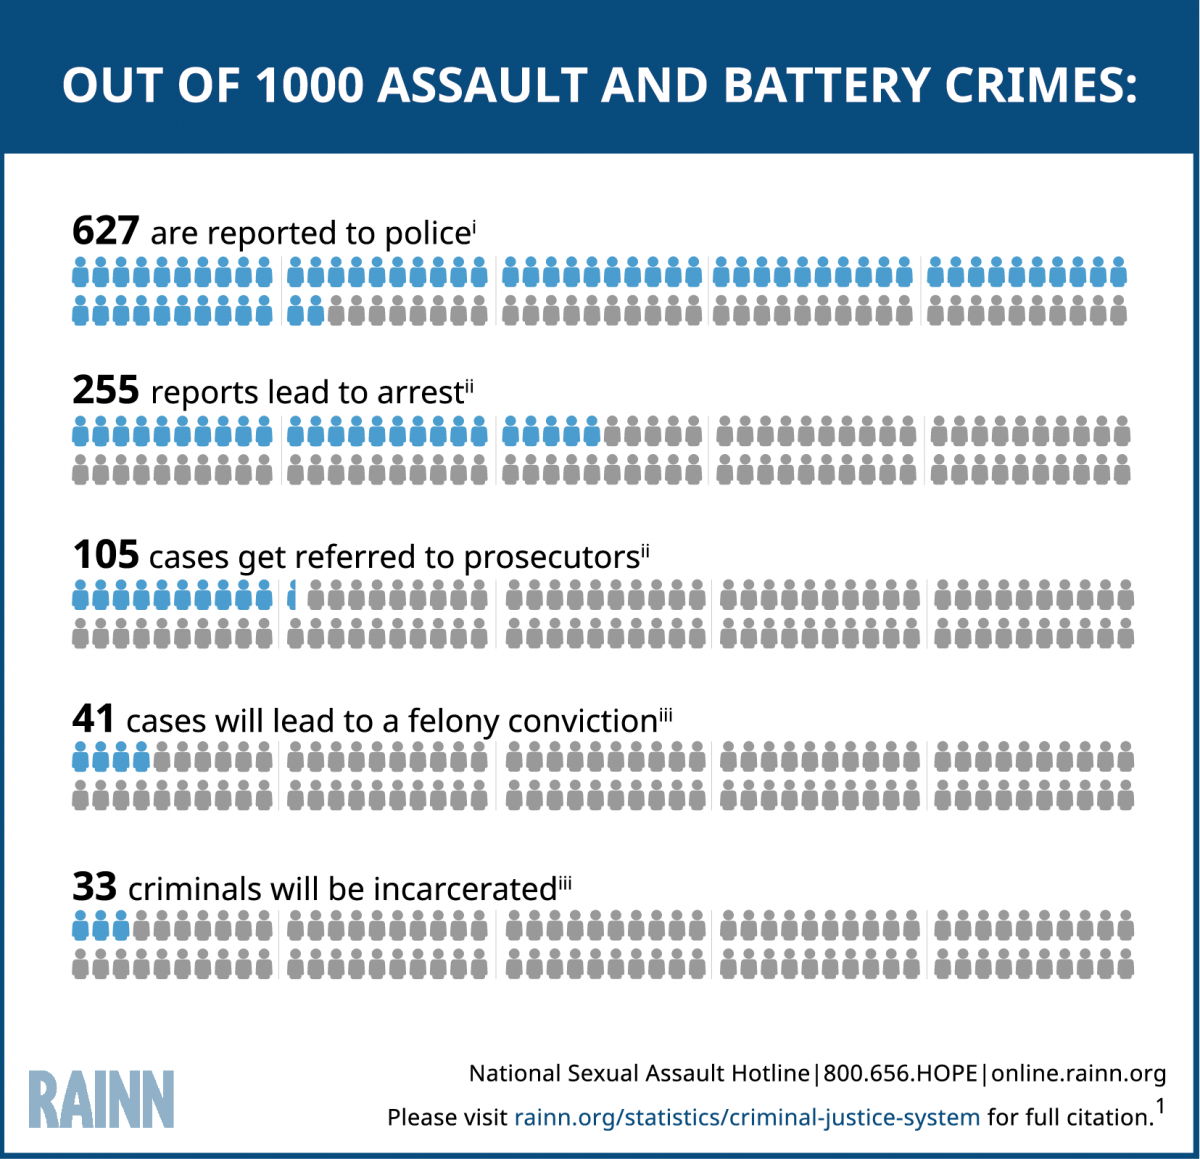
Perpetrators of sexual violence are less likely to go to jail or prison than other criminals.
.
The Majority of Sexual Assaults Are Not Reported to the Police
Only 310 out of every 1,000 sexual assaults are reported to police. That means about 2 out of 3 go unreported.1
- Individuals of college-age2
- Female Students: 20% report
- Female Non-Students: 32% report
- The elderly: 28% report3
- Members of the military: 43% of female victims and 10% of male victims reported.4
Reasons Victims Choose Not to Report
Of the sexual violence crimes reported to police from 2005-2010, the survivor reporting gave the following reasons for doing so:5
- 28% to protect the household or victim from further crimes by the offender
- 25% to stop the incident or prevent recurrence or escalation
- 21% to improve police surveillance or they believed they had a duty to do so
- 17% to catch/punish/prevent offender from reoffending
- 6% gave a different answer, or declined to cite one reason
- 3% did so to get help or recover loss
Of the sexual violence crimes not reported to police from 2005-2010, the victim gave the following reasons for not reporting:5
- 20% feared retaliation
- 13% believed the police would not do anything to help
- 13% believed it was a personal matter
- 8% reported to a different official
- 8% believed it was not important enough to report
- 7% did not want to get the perpetrator in trouble
- 2% believed the police could not do anything to help
- 30% gave another reason, or did not cite one reason
Read more statistics about perpetrators of sexual violence.
View statistics on additional topics.
.
Understanding RAINN’s statistics
Sexual violence is notoriously difficult to measure, and there is no single source of data that provides a complete picture of the crime. On RAINN’s website, we have tried to select the most reliable source of statistics for each topic. The primary data source we use is the National Crime Victimization Survey (NCVS), which is an annual study conducted by the Justice Department. To conduct NCVS, researchers interview tens of thousands of Americans each year to learn about crimes that they’ve experienced. Based on those interviews, the study provides estimates of the total number of crimes, including those that were not reported to police. While NCVS has a number of limitations (most importantly, children under age 12 are not included), overall, it is the most reliable source of crime statistics in the U.S.
We have also relied on other Justice Department studies, as well as data from the Department of Health and Human Services and other government and academic sources. When assembling these statistics, we have generally retained the wording used by the authors. Statistics are presented for educational purposes only. Each statistic includes a footnote citation for the original source, where you can find information about the methodology and a definition of terms.
Learn more about RAINN’s statistics.
Sources:
- i. Department of Justice, Office of Justice Programs, Bureau of Justice Statistics, National Crime Victimization Survey, 2010-2014 (2015); ii. Federal Bureau of Investigation, National Incident-Based Reporting System, 2012-2014 (2015); iii. Federal Bureau of Investigation, National Incident-Based Reporting System, 2012-2014 (2015); iv. Department of Justice, Office of Justice Programs, Bureau of Justice Statistics, Felony Defendants in Large Urban Counties, 2009 (2013). (This statistic presents information together which originated from separate studies. RAINN presents this data for educational purposes only, and strongly recommends using the citations to review any and all sources for more information and detail.)
- Department of Justice, Office of Justice Programs, Bureau of Justice Statistics, Rape and Sexual Victimization Among College-Aged Females, 1995-2013 (2014).
- Department of Justice, Office of Justice Programs, Bureau of Justice Statistics, Crimes Against the Elderly, 2003-2013 (2014).
- Department of Defense, Fiscal Year 2014 Annual Report on Sexual Assault in the Military (2015).
- Department of Justice, Office of Justice Programs, Bureau of Justice Statistics, Female Victims of Sexual Violence, 1994-2010 (2013).
- Department of Justice, Office of Justice Programs, Bureau of Justice Statistics, Felony Defendants in Large Urban Counties, 2009 (2013).
- Department of Justice, Office of Justice Programs, Bureau of Justice Statistics, Prisoners in 2013 (2014).