Sexual Violence has Fallen by More than Half Since 1993
- The rate of sexual assault and rape has fallen 63% since 1993, from a rate of 4.3 assaults per 1,000 people in 1993, to 1.6 per 1000 in 2015.1
How Often Does Sexual Assault Occur in the United States?

- Every 98 seconds another American is sexually assaulted.1
Men, Women, and Children Are All Affected by Sexual Violence
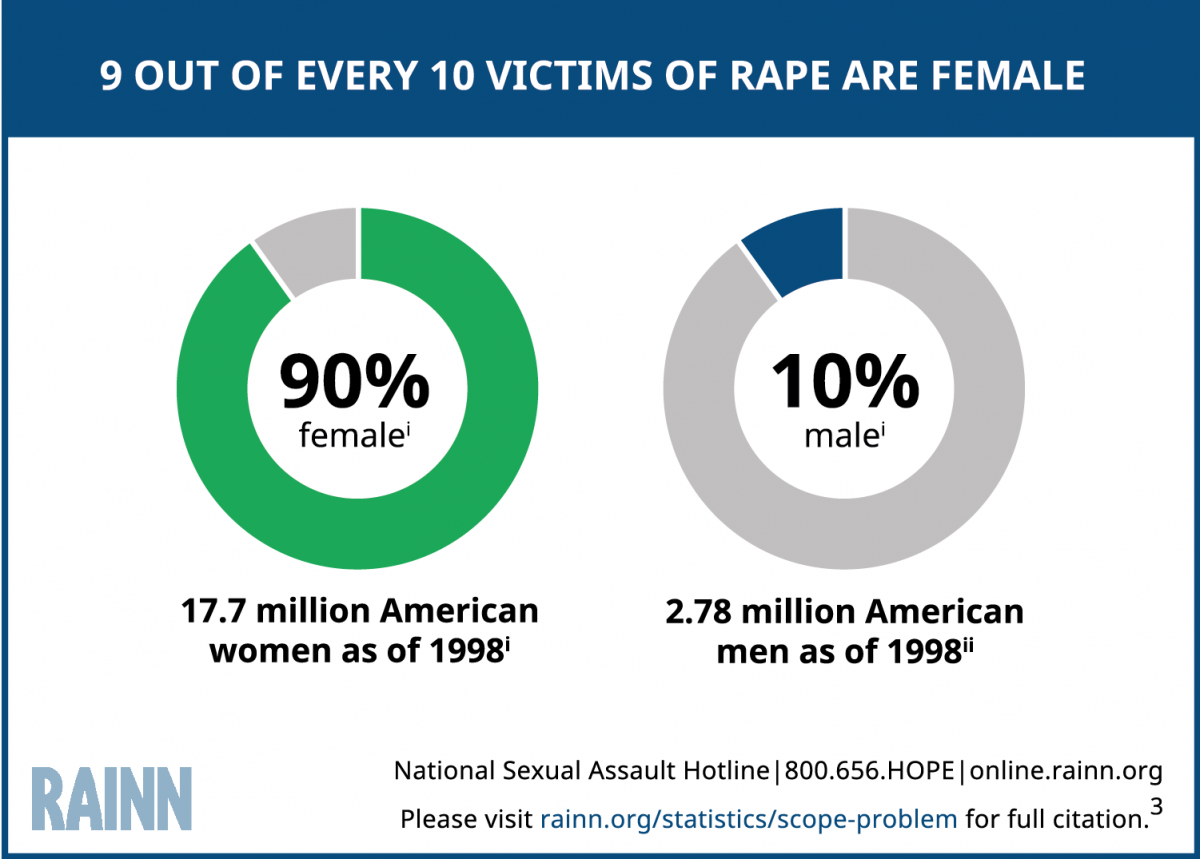
- 1 out of every 6 American women has been the victim of an attempted or completed rape in her lifetime (14.8% completed, 2.8% attempted).4
- About 3% of American men—or 1 in 33—have experienced an attempted or completed rape in their lifetime.4
- From 2009-2013, Child Protective Services agencies substantiated, or found strong evidence to indicate that, 63,000 children a year were victims of sexual abuse.5
- A majority of child victims are 12-17. Of victims under the age of 18: 34% of victims of sexual assault and rape are under age 12, and 66% of victims of sexual assault and rape are age 12-17.6
Read more statistics about child sexual abuse.

The Majority of Sexual Assaults Occur At or Near the Victim’s Home

What was the survivor doing when the crime occured?7
- 48% were sleeping, or performing another activity at home
- 29% were traveling to and from work or school, or traveling to shop or run errands
- 12% were working
- 7% were attending school
- 5% were doing an unknown or other activity
View statistics on additional topics.
.
Understanding RAINN’s statistics
Sexual violence is notoriously difficult to measure, and there is no single source of data that provides a complete picture of the crime. On RAINN’s website, we have tried to select the most reliable source of statistics for each topic. The primary data source we use is the National Crime Victimization Survey (NCVS), which is an annual study conducted by the Justice Department. To conduct NCVS, researchers interview tens of thousands of Americans each year to learn about crimes that they’ve experienced. Based on those interviews, the study provides estimates of the total number of crimes, including those that were not reported to police. While NCVS has a number of limitations (most importantly, children under age 12 are not included), overall, it is the most reliable source of crime statistics in the U.S.
We have also relied on other Justice Department studies, as well as data from the Department of Health and Human Services and other government and academic sources. When assembling these statistics, we have generally retained the wording used by the authors. Statistics are presented for educational purposes only. Each statistic includes a footnote citation for the original source, where you can find information about the methodology and a definition of terms.
Learn more about RAINN’s statistics.
Sources:
- Department of Justice, Office of Justice Programs, Bureau of Justice Statistics, National Crime Victimization Survey, 2010-2014 (2015).
- i. Department of Justice, Office of Justice Programs, Bureau of Justice Statistics, Sexual Victimization in Prisons and Jails Reported by Inmates, 2011-2012 (2013); ii. United States Department of Health and Human Services, Administration for Children and Families, Administration on Children, Youth and Families, Children’s Bureau. Child Maltreatment Survey, 2012 (2013); iii. Department of Justice, Office of Justice Programs, Bureau of Justice Statistics, National Crime Victimization Survey, 2010-2014 (2015); iv. Department of Defense, Fiscal Year 2014 Annual Report on Sexual Assault in the Military, (2015.) (This statistic presents information that references victims from varied demographics and time ranges. Specifically, the number of Americans assaulted includes those age 12 and older, and the number of child sexual abuse victims includes minors, some of whom are 12 and older. While this may mean data is overlapped, RAINN presents this data for educational purposes only, and strongly recommends using the citations to review any and all sources for more information and detail.)
- i. Department of Justice, Office of Justice Programs, Bureau of Justice Statistics, Female Victims of Sexual Violence, 1994-2010 (2013); ii. National Institute of Justice & Centers for Disease Control & Prevention, Prevalence, Incidence and Consequences of Violence Against Women Survey (1998). (This statistic presents information on the total number of male and female victims in the United States, using a study from 1998. Because the U.S. population has increased substantially since then, it is probable that the number of victims has as well. RAINN presents this data for educational purposes only, and strongly recommends using the citations to review any and all sources for more information and detail.)
- National Institute of Justice & Centers for Disease Control & Prevention, Prevalence, Incidence and Consequences of Violence Against Women Survey (1998).
- United States Department of Health and Human Services, Administration for Children and Families, Administration on Children, Youth and Families, Children’s Bureau. Child Maltreatment Survey, 2012 (2013).
- Department of Justice, Office of Justice Programs, Bureau of Justice Statistics, Sex Offenses and Offenders (1997).
- Department of Justice, Office of Justice Programs, Bureau of Justice Statistics, Female Victims of Sexual Violence, 1994-2010 (2013). (Due to rounding, this statistic may not total 100%. RAINN presents this data for educational purposes only, and strongly recommends using the citations to review any and all sources for more information and detail.)

